Monday, January 20, 2014
Sunday, January 12, 2014
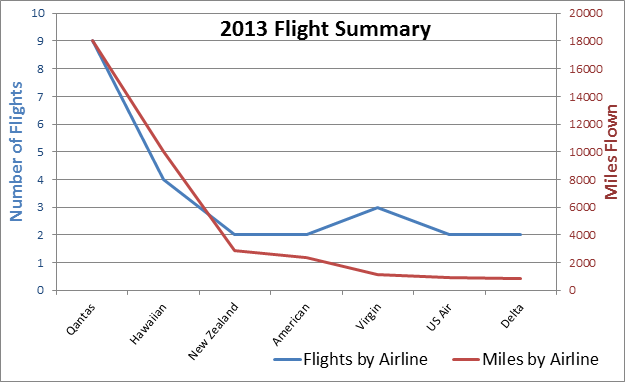
Annual Report - Trip Details
EUROPEAN CITIES VISITED

The red markers are the cities we visited in 2011. We flew from Memphis to Amsterdam. Again used Eurotrain to visit Paris, Munich, Innsbruck, Salzburg, Vienna, and then Prague.
NEW ZEALAND ROUTE
Day 2: Spent afternoon in Queenstown, made our way to Te Anau by nightfall.
Day 3: Drove through Fiordland National Park to take boat tour of Milford Sound. Spent night again in Te Anau.
Day 4: Made our way to the Catlin Coast, then drove along it to Dunedin. Along the way stopped at Cozy Nook and Nugget Point.
Day 5: Toured Dunedin, then drove to Christchurch. Along the way saw Yellow Eyed Penguins at Curio Bay.
U.S. ROAD TRIPS
The green route is the move from Des Moines, Iowa to Houston, Texas. After spending a couple days in Quincy packing, we spent the night just south of Dallas.
The red route is our move from Houston to Bakersfield, CA. We turned over our apartment keys in the afternoon and were in San Antonio (1) that night. After driving the entire next day, we still didn't make it out of Texas, spending the night in El Paso (2). Day 3 of driving saw us reach Blythe (3). We reached Bakersfield by noon the following day.
The blue route is our move from Bakersfield to Quincy. We left Bakersfield at around 1pm, ate dinner in Flagstaff and spent the night in Winslow (1). The following day we drove around 900 miles and spent the night in El Dorado (2). We arrived in Quincy at 1pm the next day.
Thursday, January 9, 2014
Monday, January 6, 2014
Annual Report - Where We've Been Since 2008
It's time for the Annual Report, where our lives are described through various graphics. It wouldn't be a good graph or chart if descriptions were needed, so my goal is to not overly explain anything. That being said, there is some data that does need to be clarified. Today we look at how our weekends were distributed, data I started collecting in the fall of 2008.
Katie and I have been together on 95.4% of the weekends since this tracking began. Because of that, our individual graphs like the one above are almost identical. Although the difference would be imperceptible, her proportion of time spent in Indiana would be larger, while her time in Illinois would be smaller.

Subscribe to:
Posts (Atom)


